
Understand your exposure
Distinguish the security dashboard, scopes, assets and findings.
Access: member, tool creation. Subject to enabled modules and your plan.
Available workspaces
Open Operational Safety to view the dashboard. Advanced scopes, assets and findings require activation and tool-creation permission.
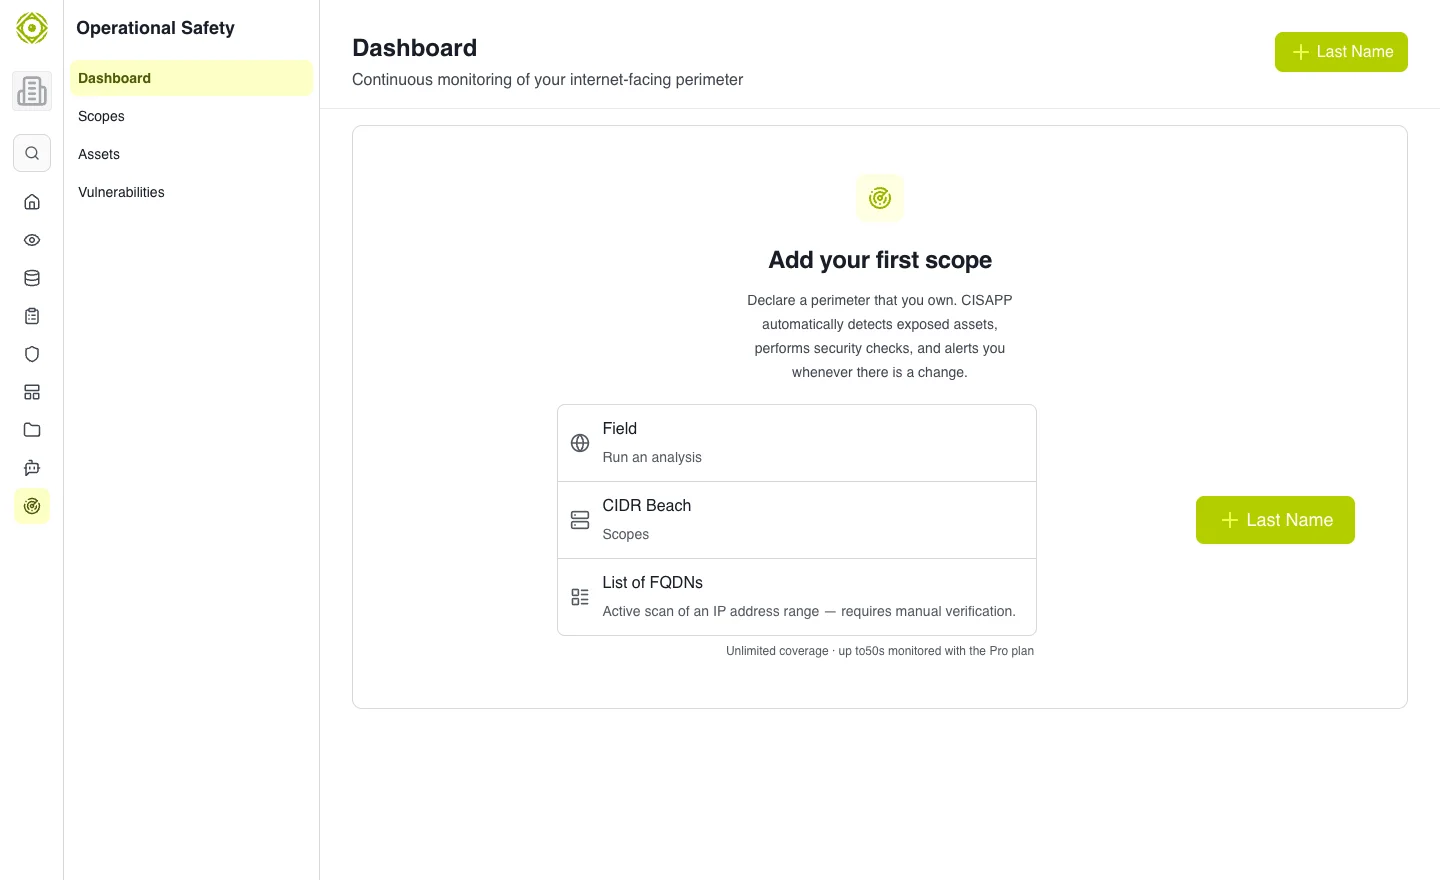
The dashboard distinguishes scope types and monitoring of exposed assets. · Open full-size screenshot
| Item | Purpose |
|---|---|
| Scope | Define domains, FQDNs or addresses to monitor. |
| Asset | Represent an item discovered or declared in the scope. |
| Analysis | Run an offered discovery or check. |
| Finding | Record detected exposure or an issue. |
Read the overview
Check coverage and the dates of recent analyses. Consider a partial score or absence of findings alongside analyses actually executed. An empty page before any analysis does not mean there are no issues.
My exposure
My Exhibition, Certifications, My clients and Shares in that workspace are currently under construction. They should not be treated as an operational posture-sharing portal in this version.
Expected outcome
You understand the data feeding the overview and what remains to be checked. To configure monitoring, see Scopes and analyses.